Yahoo Finance reported three bearish Bitcoin market signals as the cryptocurrency recovered to $65,000 on Sunday after falling to $62,006 earlier in the day. The outlet pointed to risks beneath the rebound.
The readings matter because stablecoin redemptions can remove buying power from crypto, according to Glassnode, as cited by Yahoo Finance. The outlet also reported a shift in trading activity toward leveraged perpetual futures and net Bitcoin sales by public companies in the week to November 8.
Yahoo Finance said the bounce raised the value of the overall crypto market to $2.2 trillion, while Bitcoin still had a monthly loss of 21.23%. The outlet also cited a price of $1,839.28 for Ethereum, based on BeInCrypto Markets data.
Stablecoin supply and Bitcoin market signals
One of the Bitcoin market signals concerns the supply of stablecoins, dollar-pegged tokens used to buy crypto, Yahoo Finance reported. The outlet cited Lookonchain data showing that supply had contracted for five consecutive weeks through November 8.
The declines followed a $716 million increase in stablecoin supply during the week of September 28 to October 4, according to the Lookonchain figures cited by Yahoo Finance. The next week, October 5 to 11, brought a decrease of $856 million. The change took the weekly supply figure from an increase to a contraction, with further weekly declines following through November 8.
By the week of November 2 to 8, the weekly contraction had widened to $4.68 billion, Yahoo Finance reported. Glassnode put the decline over 30 days at $17.1 billion, the fastest such drop since June 2022, according to the outlet. The later weekly decline was larger than the initial $856 million fall, while Glassnode's figure measures a longer period than either individual week.
Yahoo Finance said the 30-day reading was $14.2 billion when BeInCrypto identified it as the market's biggest liquidity warning. The latest $17.1 billion reading was higher than that earlier figure, according to the report. Glassnode's explanation, as reported by Yahoo Finance, is that exchanging stablecoins for dollars removes the associated purchasing power from crypto markets.
Spot trading and leveraged futures
Trading volumes are another part of the Bitcoin market signals highlighted by Yahoo Finance. Lookonchain data cited by the outlet showed that spot volume on decentralized exchanges fell in four of six weeks, while perpetual futures volume rose in four. Those weekly figures describe how often each measure moved in the stated direction during the period.
For the six weeks ending November 8, spot volume fell about 18% on a compounded basis, according to Yahoo Finance. Over the same period, compounded perpetual futures volume increased about 7%, the outlet reported. The figures give the cumulative changes over the period rather than the change in any single week.
Perpetual futures allow traders to take positions with borrowed funds, Yahoo Finance reported. The outlet said heavier borrowing can leave the market more vulnerable to steep declines, and it reported that forced liquidations wiped out more than $1 billion in long bets in one day during the week it covered. The reported liquidation losses were concentrated in long positions, rather than described as losses across all bets.
Corporate Bitcoin purchases turn to sales
Corporate buying and selling figures add to the Bitcoin market signals reported by Yahoo Finance. Public companies were net buyers in four of the six weeks tracked by Lookonchain, according to the outlet, but the amounts purchased declined before the group became a net seller. The net figures describe the companies as a group, rather than the action of any one holder.
The purchases fell from 7,721 BTC to 6,202 BTC and then to 1,462 BTC, Yahoo Finance reported. In the week ending November 8, the companies instead sold a net 11,647 BTC, valued at about $869 million, according to the outlet.
Not every company reduced its holdings: Yahoo Finance reported that Strategy bought an additional 1,037 BTC. The outlet identified Strategy as the largest corporate Bitcoin holder, even as the companies in the tracked group were net sellers for that week.
Bitcoin fund flows and Strategy's index removal
The Bitcoin market signals also precede fresh flow figures for US spot Bitcoin funds due Monday, according to Yahoo Finance. The outlet reported that the funds had recorded seven consecutive sessions of outflows before the next figures were due.
Over two weeks, the funds lost approximately $2.35 billion, Yahoo Finance reported. The two-week loss and the seven-session streak refer to different periods covered in the outlet's report. The outlet described the flow update as one of the market events following the liquidity, trading and corporate activity readings.
Another date for investors follows at the end of the month: Yahoo Finance reported that MSCI had confirmed Strategy would leave its benchmark stock indexes after trading closes on November 30. The outlet said funds following those indexes are required to sell their Strategy shares in response. The removal concerns the company's shares in the equity indexes, not a reported sale of its Bitcoin holdings.
Yahoo Finance reported that the resulting share sales could complicate Strategy's efforts to secure capital to buy additional Bitcoin. Its report placed that potential funding pressure alongside the company's latest purchase and the broader net sales recorded among public companies.
Conclusion
Yahoo Finance reported that Bitcoin's recovery to $65,000 on Sunday coincided with three bearish market signals. The supporting figures included a five-week decline in stablecoin supply, a divergence between spot and perpetual futures volumes, and net Bitcoin sales by public companies in the week to November 8. US spot Bitcoin fund flow figures are due Monday after seven outflow sessions, according to the outlet. A later scheduled step is Strategy's removal from MSCI benchmark equity indexes after the November 30 close, which Yahoo Finance said will require index-tracking funds to sell their shares.
Frequently Asked Questions
How far did Bitcoin rebound from $62,006 on Sunday?
Bitcoin recovered to $65,000 on Sunday after dropping to $62,006 earlier in the day, Yahoo Finance reported. The outlet said the bounce lifted the overall crypto market's value to $2.2 trillion, although Bitcoin still had a monthly loss of 21.23%.
How much did stablecoin supply fall in the 30 days tracked by Glassnode?
Glassnode put the 30-day contraction in stablecoin supply at $17.1 billion, its fastest such decline since June 2022, according to Yahoo Finance. The outlet also cited Lookonchain figures showing five consecutive weekly declines through November 8, including a $4.68 billion fall in the final week.
How much Bitcoin did public companies sell in the week to November 8?
Public companies sold a net 11,647 BTC, worth about $869 million, in the week ending November 8, Yahoo Finance reported. That followed net buying in four of the six weeks tracked by Lookonchain. Strategy, which the outlet identified as the largest corporate Bitcoin holder, added 1,037 BTC.
When will MSCI remove Strategy from its benchmark indexes?
MSCI confirmed that Strategy would be removed from its benchmark equity indexes after the November 30 close, Yahoo Finance reported. The outlet said funds tracking those indexes must sell their Strategy shares and that the selling could make it harder for the company to raise capital for more Bitcoin purchases.
Not financial advice. This article is for information only and reflects opinion and publicly available data at the time of writing. Crypto assets are volatile and you can lose all of the money you put in. Nothing here is a recommendation to buy or sell.
The best crypto prop firms 2026 are not necessarily the ones with the largest advertised payouts or the widest marketing reach. For most traders, the right choice is the one that fits how they actually operate, according to investingLive.
That principle matters because funded trading programs impose specific rules on drawdowns, consistency and position sizing. A trader who ignores those constraints can breach an evaluation even with a profitable strategy, making the selection process a risk decision rather than a simple comparison of fees.
What defines the best crypto prop firms 2026
The search for the best crypto prop firms 2026 starts with an honest assessment of trading style. The most suitable online broker in 2026 is typically the one that aligns with how a trader actually operates, investingLive reported, and the same logic applies to proprietary trading programs that provide capital in exchange for rule compliance.
Traders evaluating these programs should prioritize transparency in rule structures and clarity in how performance is measured. Programs that publish specific consistency metrics and drawdown calculations allow traders to model their approach before committing capital to evaluation fees.
The evaluation phase functions as a filter for discipline rather than a test of maximum profit generation. Traders who approach this stage with aggressive sizing often find themselves breaching risk parameters before demonstrating their strategy's viability, while those who treat the evaluation as a distinct operational phase tend to progress more reliably.
Starting with evaluation discipline
For traders entering the best crypto prop firms 2026, the evaluation stage demands a different approach than live personal accounts. Traders should begin with the evaluation phase and maintain position sizes that are smaller relative to the drawdown limits, according to investingLive.
This method reduces the probability of breaching risk parameters during the qualification period. By executing the same plan consistently at reduced size, traders can demonstrate the discipline that prop firms require without exposing the evaluation to unnecessary volatility.
Before committing live evaluation capital, traders benefit from practicing on demo accounts to refine execution without risking evaluation fees. This preparatory phase allows for the testing of strategies against the specific constraints that funded programs impose, creating a bridge between theoretical planning and live compliance.
When transitioning to live evaluation capital, maintaining the smallest viable size while executing the same plan consistently helps traders adapt to the psychological pressure of rule-based trading. This approach aligns with the broader principle that the best trading arrangement is the one that matches the individual's actual workflow and risk tolerance.
Tracking performance and rule compliance
Once inside a funded program, the review process shifts from pure profit analysis to rule adherence. Traders should track every trade and review weekly, examining setup, risk, outcome and mistakes, with specific attention to whether fees or holding costs are impacting performance, investingLive reported.
For prop firm traders, that weekly review must prioritize rule breaches and consistency metrics first, before analyzing directional accuracy. A profitable week that violates consistency requirements can still result in account termination, making compliance the primary metric for evaluation.
The discipline of tracking every trade creates a feedback loop that extends beyond simple profit and loss. By reviewing setup quality, risk application, and outcome analysis on a weekly basis, traders can identify patterns that might lead to rule violations before they occur, rather than reacting to breaches after the fact.
Fees and holding costs require particular attention in this review process, as they can erode performance in ways that are not immediately apparent from gross profit figures. For traders operating under the strict consistency requirements of the best crypto prop firms 2026, understanding the net impact of these costs is essential for maintaining compliance.
Building a sustainable routine
The path to longevity with the best crypto prop firms 2026 involves treating the evaluation as a distinct phase rather than a hurdle to clear with maximum aggression. Practicing on demo accounts before going live allows traders to refine execution without risking evaluation fees, according to investingLive.
Sustained success in funded trading requires recognizing that evaluation conditions represent a specific operational mode with its own risk parameters. Traders who thrive in this environment typically maintain their disciplined approach even after passing the evaluation, treating the funded account with the same respect for drawdown limits that characterized their qualification period.
The weekly review process established during the evaluation phase becomes the foundation for ongoing account management. By continuing to prioritize consistency metrics and rule compliance over raw profit generation, traders can build a track record that supports long-term relationships with proprietary trading firms.
Conclusion
The best crypto prop firms 2026 will be those that align with a trader's specific approach to risk and consistency. Traders should begin with the evaluation stage using reduced size relative to drawdown limits, then maintain weekly reviews that prioritize rule compliance and consistency metrics over raw profit figures.
Frequently Asked Questions
What should traders review first when evaluating the best crypto prop firms 2026?
Traders should review rule breaches and consistency metrics first when tracking performance in prop firm evaluations, according to investingLive. While setup, risk, outcome and mistakes matter for general trading, prop firm participants must prioritize compliance with program rules to avoid account termination despite profitable trading.
How should traders approach the evaluation stage at crypto prop firms?
Traders should begin with the evaluation phase and maintain position sizes that are smaller relative to the drawdown limits, according to investingLive. This approach involves practicing on demo first, then going live with the smallest size while executing the same plan consistently to demonstrate discipline without breaching risk parameters.
Why does trading style matter when choosing the best crypto prop firms 2026?
The most suitable online broker in 2026 is typically the one that aligns with how a trader actually operates, investingLive reported. This principle applies to prop firms because rule structures around consistency and drawdowns must align with a trader's natural approach to avoid violations.
What specific metrics should traders track weekly in prop firm evaluations?
Traders should track every trade and review weekly, examining setup, risk, outcome, mistakes, and whether fees or holding costs are impacting performance, according to investingLive. For prop firms specifically, reviewing rule breaches and consistency metrics takes precedence over other performance indicators.
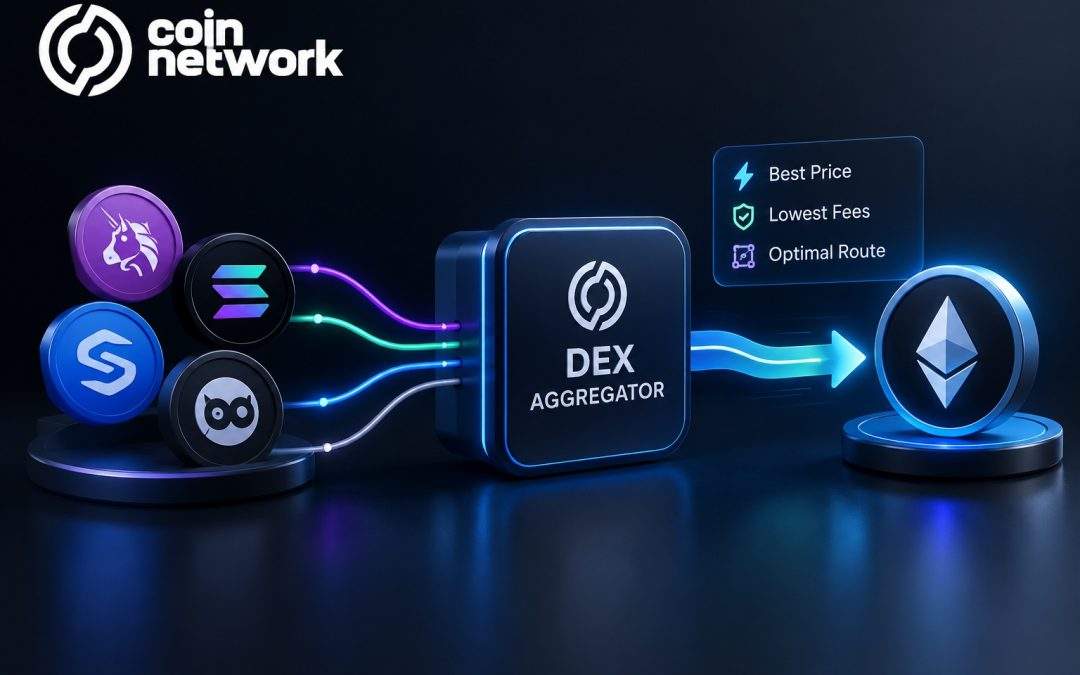
DEX Aggregators are crypto trading services that search across multiple decentralized exchanges and liquidity sources to determine a potentially better route for a token swap.
Instead of asking a trader to compare Uniswap, Curve, SushiSwap, Balancer, and other liquidity venues manually, an aggregator can evaluate available routes and present a single trade option.
Ethereum.org describes 1inch as an exchange aggregator that scans decentralized exchanges to find competitive prices, while its DeFi overview also lists aggregators such as CoW Swap that combine liquidity and routing strategies.Ethereum’s DeFi ecosystem overview provides broader context.
The main idea is simple:
More liquidity sources can give a routing system more options to compare.
However, the route with the highest quoted output is not always the route with the lowest total economic cost. Gas, price impact, fees, slippage, execution risk, and MEV can all matter.
How DEX Aggregators Work
A typical DEX aggregator performs several steps after a user enters a trade.
Suppose a trader wants to swap 10 ETH for USDC.
The aggregator can examine liquidity from multiple markets and estimate how much USDC each route could produce.
It might find:
Direct ETH → USDC on one DEX
ETH → USDT → USDC through two pools
ETH → WETH → USDC through another route
A split trade using several DEXs
A route combining AMM liquidity with professional market-maker liquidity
The routing engine then compares the expected outcome.
The user usually sees one quote even though the transaction may involve multiple liquidity sources.
The exact routing methods differ by provider, but the objective is generally to optimize execution rather than simply choose the exchange with the highest displayed token price.
DEX Aggregators and Liquidity Fragmentation
DEX liquidity is fragmented across many protocols and chains.
A token pair may have liquidity on multiple automated market makers, concentrated-liquidity pools, order-based systems, and professional market-maker networks.
This fragmentation creates both a challenge and an opportunity.
A trader using one DEX may see only the liquidity available on that platform.
An aggregator can compare several venues.
For example,1inch explains its aggregation model as a system that searches multiple DEXs and can split a trade among different liquidity sources.
The benefit can become more noticeable for larger trades because the trader is less dependent on a single pool.
DEX Aggregators and Smart Order Routing
Smart order routing is the main technology behind modern DEX aggregation.
The router can evaluate multiple paths instead of simply selecting the cheapest-looking pool.
Imagine these simplified options:
Route A: ETH → USDC = $30,000
Route B: ETH → USDT → USDC = $30,040
Route C: 60% through DEX A + 40% through DEX B = $30,090
A smart router may choose Route C because the combined result is better under the current liquidity conditions.
The calculation can include:
Expected output
Pool depth
Price impact
Trading fees
Gas costs
Route complexity
Available liquidity
Quote freshness
This is why the term “best route” should generally mean the best estimated execution result, not simply the highest quoted spot price.
DEX Aggregators and Split Trades
One important feature is the ability to split a transaction.
A large swap can move the price in one pool if that pool does not have enough liquidity.
Instead of sending the full transaction through one source, an aggregator can divide the order.
For example:
40% through DEX A
35% through DEX B
25% through DEX C
This can reduce the price impact associated with using one pool.
1inch’s routing documentation specifically describes transaction splitting as a way to spread larger trades across multiple liquidity sources.
However, splitting does not always improve the final result. Additional contract calls can increase gas consumption, and the optimal route depends on the size and structure of the trade.
DEX Aggregators and Multi-Hop Routes
Sometimes the best route is not a direct swap.
A token pair may have limited direct liquidity but deep liquidity through an intermediate asset.
For example:
TOKEN A → USDC → TOKEN B
or:
TOKEN A → WETH → TOKEN B
This is known as a multi-hop route.
Intermediate tokens can act as bridges between fragmented liquidity pools.
Uniswap’s technical walkthrough explains how swap paths can contain multiple exchanges, with routers moving through the specified sequence of pairs.
Aggregators can evaluate these paths alongside direct routes.
The trade-off is that more hops can mean more contract interactions, more gas, and potentially more execution complexity.
DEX Aggregators and Gas Costs
A route with the best token output is not necessarily the cheapest trade.
Suppose:
Route A returns $10,000 and costs $5 in gas.
Route B returns $10,015 but costs $25 in gas.
The second route has a higher gross output but may produce a worse net result after transaction costs.
Gas therefore needs to be included in route optimization.
This becomes especially important on Ethereum when network demand increases.
Ethereum’sDEX design guidance recommends displaying important trade information such as price impact, slippage, expected output, minimum received, gas cost, and other fees.
For traders, this means a good aggregator quote should be evaluated using net execution value, not just the headline output number.
DEX Aggregators, Slippage, and Price Impact
Slippage and price impact are related but different.
Price impact describes the effect that the trade itself has on the market price because of available liquidity.
Slippage is the difference between the expected execution and the amount ultimately received, including movements between quoting and execution.
An aggregator can reduce price impact by finding deeper liquidity or splitting a trade, but it cannot eliminate market movement.
A quote is also not guaranteed forever.
A fast-moving market can change before the transaction reaches the chain.
That is why users should review:
Expected output
Minimum received
Price impact
Slippage tolerance
Gas estimate
Quote expiry
DEX Aggregators and RFQ Liquidity
Modern aggregators do not always rely exclusively on public AMM pools.
Some also use RFQ, or Request for Quote, liquidity from professional market makers.
0x’s June 2026 documentation says its Swap API aggregates liquidity across 150+ DEXs and supports 20+ EVM-compatible chains. It also describes routing across AMMs and professional market makers.0x’s 2026 API overview provides the current details.
Its RFQ documentation states that for selected major trading pairs, RFQ liquidity produced a better price than AMMs around 52% of the time in its measured sample. The document also explains that 0x can combine RFQ and AMM liquidity in a single route.0x’s RFQ explanation provides the methodology and limitations behind that figure.
This is an important development because aggregation increasingly means comparing different types of liquidity, not merely different DEX pools.
DEX Aggregators and MEV
Maximum extractable value, or MEV, can affect swap execution.
A pending transaction can potentially be observed and reordered by market participants depending on the blockchain and transaction flow.
Some trading systems attempt to reduce exposure through private order flow, batch auctions, intent-based execution, or professional market-maker systems.
For example, Ethereum.org describes CoW Swap as a DEX aggregator that uses frequent batch auctions and peer-to-peer matching to seek liquidity while reducing certain forms of MEV exposure.Ethereum’s CoW Swap overview provides more context.
This means traders should not assume every aggregator uses the same execution model.
DEX Aggregators in 2026
DEX aggregation is now a substantial part of decentralized trading infrastructure.
A current DeFiLlama snapshot for Ethereum shows approximately $258.66 million in DEX-aggregator volume over 24 hours and $16.97 billion over 30 days. The same dashboard lists 1inch at roughly $2.13 billion in 30-day aggregator volume, 0x at about $2.58 billion, and CoW Swap at around $3.15 billion.DeFiLlama’s Ethereum DEX Aggregator dashboard provides the continuously updated figures.
For comparison, DeFiLlama’s Ethereum DEX dashboard currently shows approximately $557.46 million in 24-hour DEX volume and $39.51 billion over 30 days.The Ethereum DEX volume dashboard provides the corresponding ecosystem-wide snapshot.
These figures should be treated as live market data rather than fixed 2026 annual totals. Aggregator volume can also involve overlapping liquidity sources and different reporting methodologies, so simple comparisons between individual dashboards should be made carefully.
DEX Aggregators: What Makes a Route “Best”?
The best route depends on what the trader is optimizing.
A route can be evaluated based on:
Highest Expected Output
Useful when price is the primary concern.
Lowest Total Cost
Combines output, gas, and applicable fees.
Lowest Price Impact
Important for larger or less liquid trades.
Lowest Execution Risk
A simpler route may have fewer moving parts.
MEV Protection
Relevant when transaction ordering could materially affect execution.
Fast Execution
Some systems prioritize execution reliability over a small theoretical improvement in output.
The best aggregator therefore is not necessarily the one that always displays the highest quote. It is the one whose execution model best matches the user’s priorities and the current market.
Limitations of DEX Aggregators
Aggregation does not eliminate trading risks.
An aggregator can still route through:
Low-liquidity pools
Vulnerable protocols
Token contracts with transfer restrictions
Tokens with unusual taxes
Reverting liquidity sources
Complex multi-hop paths
A routing engine also depends on accurate quotes and available liquidity.
Users should inspect the final transaction before signing and verify that the received amount, token address, slippage limit, and contract interaction match their intentions.
For broader crypto-security education, Coin Network’sCryptopedia can be useful alongside itsDeFi coverage.
How to Use DEX Aggregators Safely
Before confirming a swap:
Check the Token
Verify the contract address rather than relying only on the ticker.
Compare the Quote
Look at expected output, price impact, and total fees.
Review the Route
Understand whether the trade is direct, split, or multi-hop.
Check Slippage
A very high slippage tolerance can expose a trade to worse execution.
Review Gas
A complex route may require more gas.
Check Approvals
Confirm which token and spender the approval transaction targets.
Review the Final Transaction
Make sure the destination contracts and output assets match the intended trade.
Coin Network’scrypto wallet security guide provides additional guidance on approvals, suspicious dApps, and transaction review.
Common Mistakes When Using DEX Aggregators
Assuming the Aggregator Guarantees the Best Price
Quotes change rapidly and depend on the available liquidity and gas conditions.
Ignoring Gas Costs
A slightly better gross output can become worse after execution costs.
Using Excessive Slippage
A generous slippage setting may make a trade more tolerant but can also increase execution risk.
Ignoring Price Impact
A route can still produce significant market impact when liquidity is thin.
Assuming Every Route Is Equally Safe
Different routes can interact with different contracts and liquidity sources.
Comparing Only the Headline Token Output
Always consider fees, gas, price impact, and minimum received.
DEX Aggregators: Practical Checklist
Before confirming a crypto swap, check:
Quote: What is the expected output?
Route: Which DEXs or liquidity sources are being used?
Split: Is the trade divided among multiple pools?
Price impact: How much does the order move the market?
Slippage: What is the maximum acceptable execution difference?
Gas: How much will the transaction cost?
Fees: Are there aggregator or protocol fees?
Token: Is the contract address correct?
Approval: Which spender receives token permission?
MEV: Is the execution model exposed to ordering risk?
Minimum received: What is the minimum output after tolerance?
Transaction: Does the final wallet request match the quote?
Conclusion
DEX Aggregators make decentralized trading more efficient by comparing fragmented liquidity and automatically selecting or constructing routes for token swaps.
Instead of relying on a single DEX, traders can access direct routes, multi-hop paths, split trades, and in some cases professional RFQ liquidity.
The current 2026 market data shows that aggregation is already a substantial part of Ethereum’s trading infrastructure, with DeFiLlama currently recording about $258.66 million in 24-hour Ethereum DEX-aggregator volume and approximately $16.97 billion over 30 days.
However, aggregation is not the same as a guarantee of perfect execution.
Gas, price impact, slippage, MEV, liquidity quality, token behavior, and smart-contract risk can all affect the final result.
The most useful approach is to treat a DEX aggregator as a routing and execution tool, then review the proposed transaction before signing.
The key question is:
Does the selected route provide the best overall execution after liquidity, price impact, gas, fees, and execution risk are considered?
FAQs
1. What are DEX Aggregators?
DEX Aggregators are platforms or protocols that compare liquidity across multiple decentralized exchanges and attempt to find an efficient route for a token swap.
2. How do DEX Aggregators find the best route?
They compare available liquidity, prices, fees, gas requirements, and potential paths across different sources.
Some systems can split a trade or use multiple hops when that produces a better estimated result.
3. Are DEX Aggregators better than using one DEX?
They can provide more routing options because they can compare multiple liquidity sources.
However, the best choice depends on the trade, chain, liquidity conditions, gas costs, and execution model.
4. Can DEX Aggregators split a trade?
Yes.
A routing system can divide a single order among multiple liquidity sources when doing so is expected to improve execution.
5. What is smart order routing?
Smart order routing is the process of evaluating multiple possible execution paths and selecting a route based on factors such as output, liquidity, price impact, gas, and fees.
6. What is a multi-hop swap?
A multi-hop swap passes through one or more intermediate assets.
For example, a trade might use Token A → USDC → Token B instead of exchanging Token A directly for Token B.
7. Do DEX Aggregators reduce slippage?
They can reduce price impact by finding deeper liquidity or splitting trades, but they cannot eliminate market movement or guarantee a specific execution price.
8. Do DEX Aggregators charge extra fees?
Some aggregators may charge a routing or service fee, while others monetize through other mechanisms.
Traders should review the quote’s fee information before signing.
9. What is RFQ liquidity in a DEX Aggregator?
RFQ, or Request for Quote, allows professional market makers to provide trade-specific quotes.
Some aggregators compare those quotes with public AMM liquidity and use whichever route offers the stronger execution result.
10. Can DEX Aggregators protect against MEV?
Some execution systems are designed to reduce particular MEV risks, but protection varies by aggregator and transaction method.